
GitHub Stats Forge
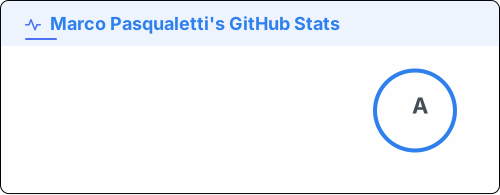
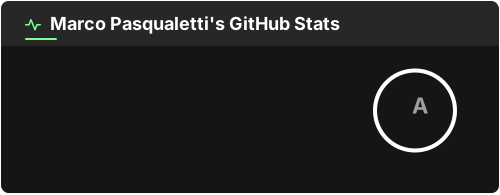
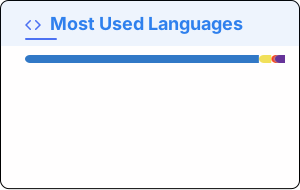
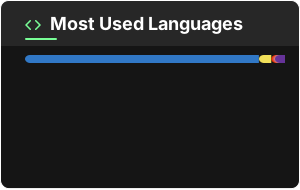
Six cards
Section titled “Six cards”Contribution stats, the languages you write most, the repositories you contribute to, a pinned repository, a pinned gist and WakaTime coding time. Every one takes the same colours, borders and 79 themes, and each has a light and a dark version. See them all.
Three ways to draw one
Section titled “Three ways to draw one”The GitHub Action is the recommended one. It renders your cards on a schedule and commits the SVGs, so nothing has to be up when someone reads your profile and a failure lands in a job log rather than in a broken image.
The CLI asks which card you want and which options it should take, then writes the SVG next to you. It is how you settle on a card before a workflow keeps it current.
The library is what both of those call. It reads no environment of its own, so the same code runs in an action, on a server and in a browser.
Every card on this site was rendered by the CLI from a saved configuration, so what you see is what the tool produces — not a screenshot.